Fleet Cost Scenarios
The purpose of this dashboard is to demonstrate how multiple scenarios can be created to help influence multiple stakeholder decisions on whether or not to increase or decrease delivery footprints based on cost.


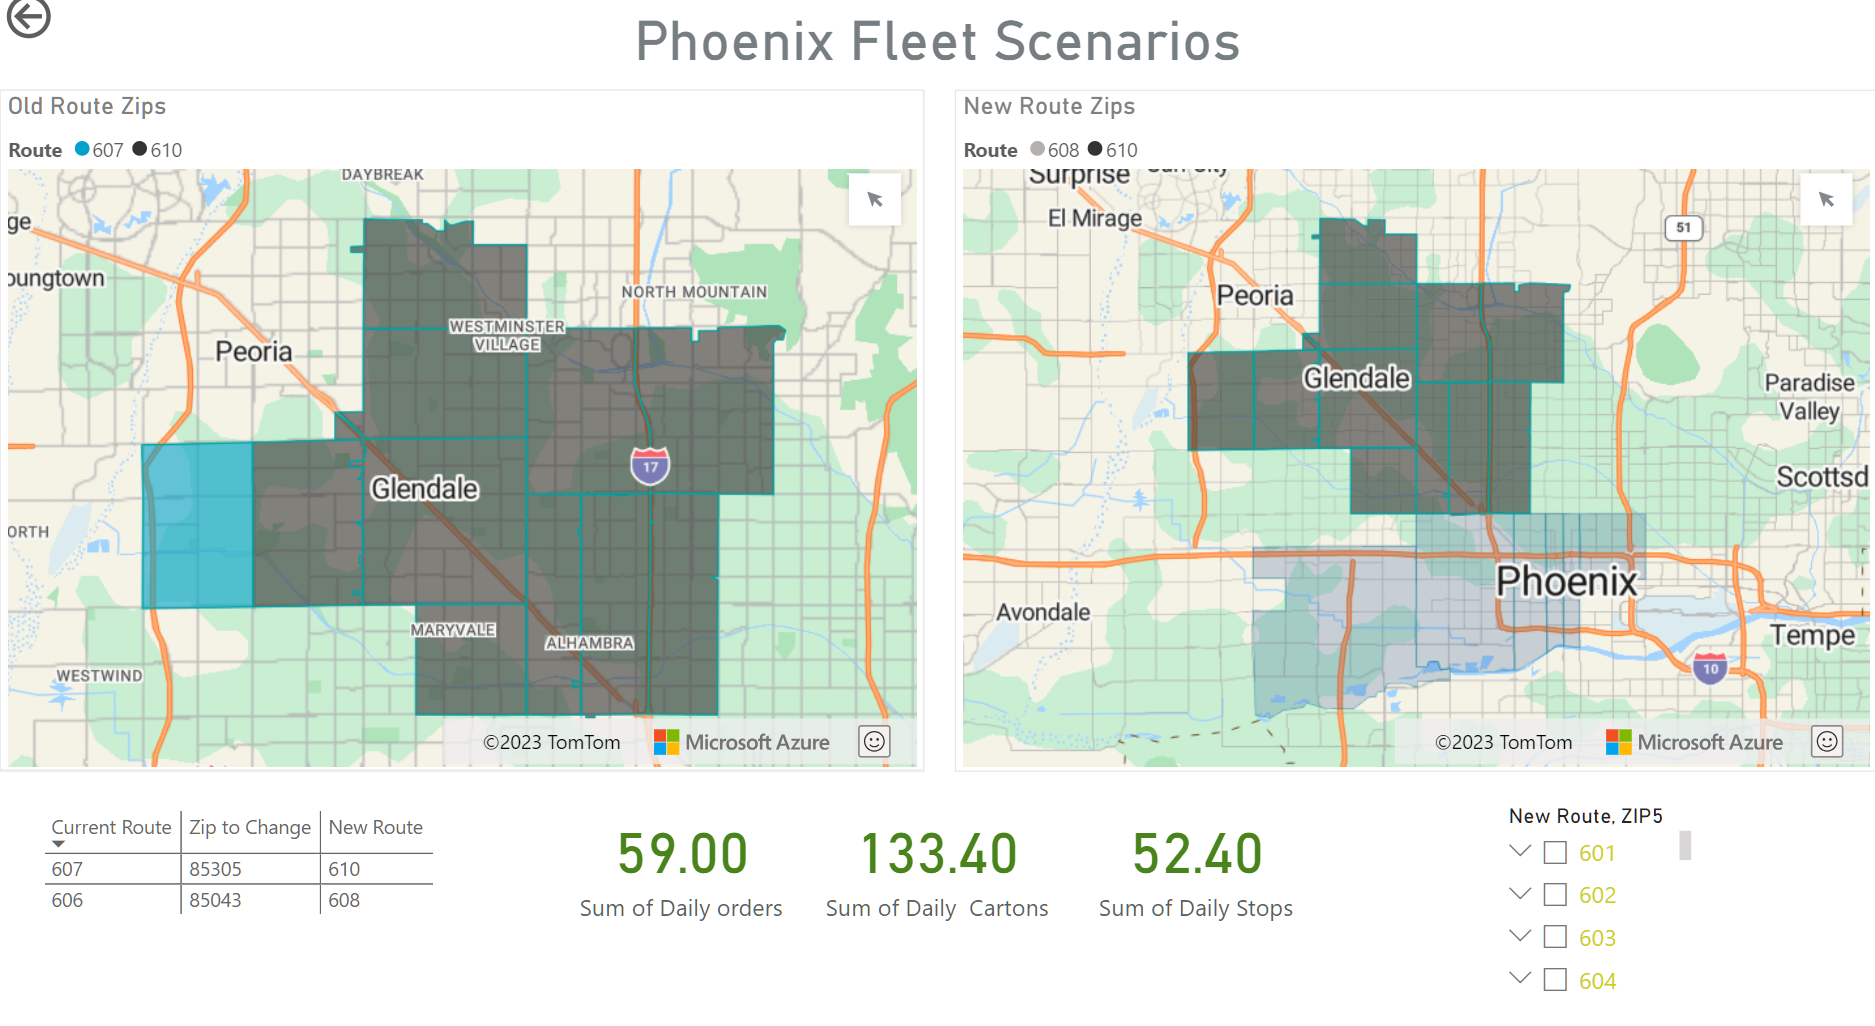
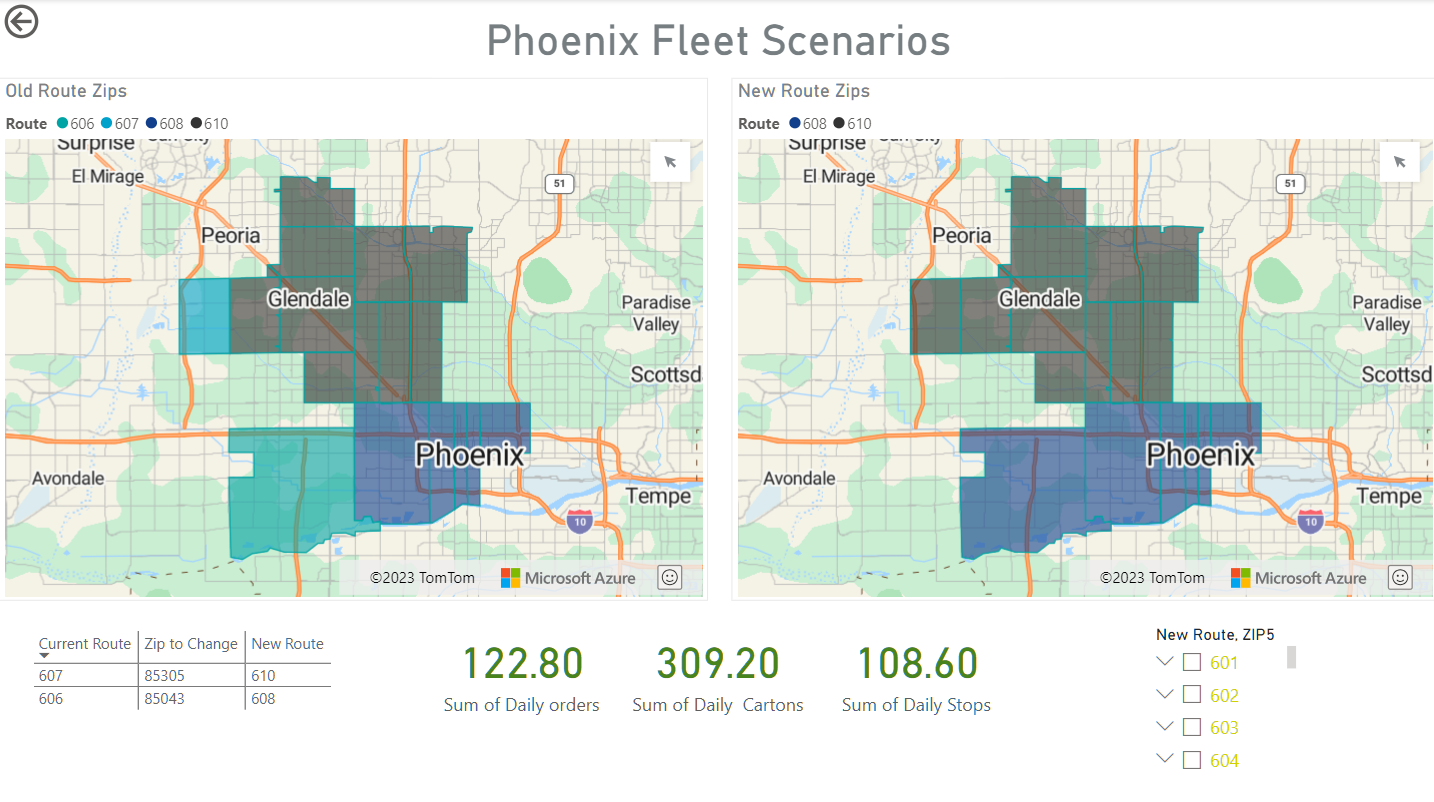

This tool has been very useful in demonstrating to regional distribution center managers on why we make changes to routes and zip codes based off data. In this specific scenario, route 606 footprint had an average of 16 stops and 16 cartons that were being outsourced to 3PL carriers at an average cost of $4.50 per carton. Adjusting zip code 85043 to 608’s footprint directly resulted in an average saving of $72 per day or $360 per week.
*Numbers have been changed to respect company privacy